
Can We Solve Noisy Historical Data with Old Newspapers?

Historical data can be messy. Very messy. I’ve complained about farmers and ngrams and historical census enumeration and linking before. But these aren’t the only kinds of messy historical data scholars interested in historical political economy (or economic history or whatever else you Broadstreet readers like) want to work with. Wouldn’t it be cool if we had some new tools and techniques to deal with data mess?
Into the void steps a new paper: Using Digitized Newspapers to Refine Historical Measures: The Case of the Boll Weevil by Andreas Ferrera, Joung Yeob Ha, and Randy Walsh. Randy presented the paper yesterday at the PIPE Workshop and, at the invitation of Broadstreet head honcho Jeff Jenkins, I discussed it. Though I suspect there’s some overlap between PIPE zoomers and Broadstreet readers, I am eager to get the ideas in this paper in front of more eyes.
I’m not an econometrician (though I do complain about some metrics things during a lot of seminars), so my comments were mostly about the application of their method, both to the boll weevil and to historical data more generally.
The basic idea is that we might be measuring some treatment of interest with noise or error. The boll weevil case is a great one to start with. Every paper (and I mean every paper and every paper) uses the famous USDA maps made by Hunter and Coad in 1923 to trace the expansion of the Boll Weevil across the south.
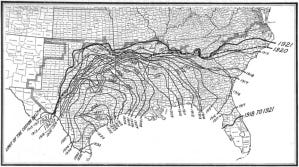
But how confident should we be in the accuracy of those lines? How confident are we that we GIS-traced the lines perfectly onto counties (with shifting borders…)? One can imagine lots of historical maps with similar issues.
There’s even a very particular issue with the Boll Weevil map. As Lange et al (2009) write on page 689:
First contact usually occurred during the August seasonal migration, too late to build up significant populations or do much damage in that year. Maximum damage occurred after the local weevil population became established and multiplied. Thus, the classic USDA maps detailing the spread of the weevil present a somewhat misleading picture of the area ravaged by the insect
So our measure of Boll Weevil exposure is noisy. And maybe a lot of other historical treatment variables are noisy. For every paper with precise borders (Hornbeck and Keniston on the Boston Fire, Schwank or Siodla on the SF Fire, Libecap and Lueck on land demarcation) there are lots of others with unclear spatial treatment. Think of Hornbeck and Naidu on the boundaries of the Mississippi Flood.
As even non-econometricians like me know, when we run a regression with a noisy X variable, we’ll get attenuation bias. That is, the estimated coefficient on X will be closer to zero than it is in reality. When I studied Sherman’s March, we showed a ton of robustness to different assumptions about how far off the march line Sherman’s “foragers” had strayed. But to the extent that our measure of where Sherman went (and destroyed) was noisy, our estimates could have been too small.
If the Boll Weevil had a huge negative effect on cotton produce and yields (as in Lange et al) or a huge positive effect on the share of African American kids going to school (as in Baker), the reported effects will be smaller in magnitude. Maybe they’ll still be significant (the Boll Weevil was a pretty big deal and some share of a big deal could still be a big deal), but maybe not.
Thankfully, there is a simple solution to measure error attenuation bias. By instrumenting for our first noisy measure with a second measure even if that second measure is itself noisy we can deal with the attenuation bias. This only works when the noise in measure one and the noise in measure two are uncorrelated. And it also requires the existence of that second measure. In doing empirical work with historical data, there aren’t usually simple additional treatment variables lying around on the ground.
But, Ferrara et al argue that such a secondary variable is widely available and that we can construct it in a lot of settings. Their solution? The newspaper. Well, not just one newspaper, but as many newspapers as we can keyword search. When a lot of newspaper articles in Mississippi-based papers with the terms “Boll Weevil” and “Marion County” start appearing, that is a pretty strong signal that the Boll Weevil has shown up in Marion County, MS. Repeat this search procedure for all other counties and, as the authors argue, we have another measure of Boll Weevil treatment.

Newspapers make terrible insulation (after two New England winters in my very cold late-nineteenth-century house, I’m reasonably sure my insulation is just newspapers). But they are a valuable data source for historical researchers, qualitative and quantitative alike.
The Ferrera et al method might be a bit noisy (some counties are poorly covered by newspapers and some are poorly covered by the newspapers.com archive, others have names that don’t transcribe or OCR well, how do we decide when coverage is “enough” to define treatment, even fake news) but as long as that noise is uncorrelated with our original measure of Boll Weevil treatment, those USDA maps, then it is a plausible second measure to use as an instrument.
(This is probably a good point to stop and remind readers, as Ferrera et al do in footnote 1 so you know it is a big deal, that even though newspaper coverage is an instrument, it is not going to help us with causality. This method is all about correcting attenuation bias in a coefficient and nothing about causality. That is, if you were worried that the original specification doesn’t yield the causal estimate of Boll Weevil exposure on outcomes, you should still be worried after we clean up the measurement error.)
The idea is simple, but that doesn’t make it any less powerful or exciting as a research tool. Once we have the second measure, we can use it in three ways. First, we can present OLS as a lower bound and IV as an upper bound to set identify the true parameter. Second, we can focus on the subsample where the two measures agree that will reduce the attenuation bias. Third, we can do some algebra (that econometricians have already blessed) to recover the parameter we care about as a nonlinear combination of the OLS and the IV. As Ferrera et al write,:
All three procedures are fast and efficient, and given that newspaper data can be scraped in a reasonable amount of time, we hope to provide researchers who work with historical data with low-cost tools for dealing with measurement error.
Does the newspaper method yield a useful measure of the Boll Weevil? The answer appears to be yes. In Figure 2, below, they plot an event study where the newspaper measure (salience of the Boll Weevil) is the outcome and the treatment is drawn from USDA map. We see no pretrend (at least when we deal with some recently toxic problems in TWFEs ala Sun and Abraham (2020)) and a nice pop up in treatment in years 0 and 1 after the Boll Weevil arrives.

And Figure 3, below, tells us that the newspaper measure and the map measure mostly agree (good!) and do differ (fine), ideally because they have uncorrelated sources of noise (impossible to prove but plausible).

In their paper, Ferrera et al then replicate two recent Boll Weevil studies and find some evidence that measurement error was attenuating the results. (I know we are all trying to do science here, but when you are looking to make a new tool and punchline is that the old standard errors were too big or the old betas were too small or we can all get more significance stars… that’s not a bad business model).
So this is the paper, what did I discuss? I think I had three main comments. The first two are extensions of the method that seem plausible, at least to me.
First, The method is all about timing. In historical work (even based off maps), treatment intensity is what matters, not timing. Think about the Dust Bowl or Sherman’s March or any other event with a clear timing but unclear impact. Can this method deliver useful measures of treatment intensity in settings where we don’t have them or where we have them imperfectly?
Second, the application is all about counties. But what about smaller geographic units like cities and towns? The Census Place Project is making great progress at putting people in the complete count on the map at a pretty precise level and—assuming your outcomes and controls can be measured more precisely than the county—no reason to think newspapers can’t recover town-level treatment timing.
The last is really a warning for future users (myself included) of this method. Do we believe that the noises in the newspaper-based measure and the original measure are uncorrelated? I think this is not as innocuous of a claim as it might appear. In the Boll Weevil case, do we buy that the contemporary mapmakers never used a then-contemporary newspaper to draw their maps? More generally, scholars will have to make this case in their own settings. Newspapers aren’t just sitting unread in archives, waiting for the newspapers.com digitization team and our scrapers. They are being read and used contemporaneously.
The method has some limitations. It seems well-suited to settings with lots of newspaper coverage AND newspaper transcription. Newspapers.com is much stronger in the US than anywhere else and much better (I think) in the early 20th century than for other periods. It really helps to have the original noisy measure (although creating geographically-varying treatment variables where we had none before is a great thing). And, at some point, if every economic historian (and the rest of you) is querying newspapers.com non-stop that might be a problem on their end and then on ours.
But I’m eager to see where Ferrera et al push their new tool and to see what the rest of us can do with it.