
The Problem(s) with Farmers

Farmers are a big empirical problem in historical social science research. This is probably true everywhere, but I’ll focus on the US where I know the data issues the best and farmers have been, repeatedly, a pain in my side. (There’s an HPE angle coming to this eventually, I promise, but this also a bit of an outlet for data frustration on my part.)
Declining Share of Farmers

Farmer was an incredibly common occupation that has nearly disappeared over the last two centuries. Looking at the complete count census data from 1850 to 1940, we can get a sense of scale. Occupation and industry coding from IPUMS (which is a more complex task than you might imagine, especially before 1910 when industry has to be imputed from the answer to the occupation question on the census).
Counting only census respondents with an occupation or an industry (so that excludes children and others out of the labor force; before the Civil War, that also excludes the largely agricultural enslaved population), we see that in 1850, 44.9% of census respondents were farmers. The next largest category was laborer at only 13.2%. That share fell, decade after decade, hitting only 10.3% in 1940. Similar trends are visible in the industry data: 57.9% of people with an industry code in 1850 were in agriculture, a number that falls to 18.1% in 1940. In every census, and usually by a large margin, farmer is the top occupation and agriculture is the top industry.
I show graphs like this to my undergrads to get a few kicks in on Thomas Malthus and his incorrect prediction that humanity would out-procreate its food sources. Increases in agricultural productivity, demonstrated quite vividly by the declining share of the population involved in agriculture, ensured that, at least in the US, food would not be a limiting factor in population growth.
(In Malthus’ defense, he had the misfortune of formulating his theories just as the Malthusian era of populations fluctuating around a stable mean via famine and death ended. There’s probably a deeper lesson about being careful about extrapolating from historical trends, but we shouldn’t be so careful that we ignore economic historians and the like.)
But these trends are also a huge empirical challenge to any work with trends over the past two centuries in the US. One has to always be careful that the fact you are documenting isn’t just this fact about farmers and their numeric decline.
Variation within Farmers
And farmers, and the data sources about them, don’t make it any easier. You see, in the US, a farmer in the census could be like James Greer Bankhead, a wealthy slaveowner and planter whose son John Hollis Bankhead served in the Senate from Alabama from 1907 to 1920; or like Willie Mae and Eddie Lewis, sharecroppers whose third child was John Lewis, the Civil Rights hero and Congressman; or any kind of farmer in between.
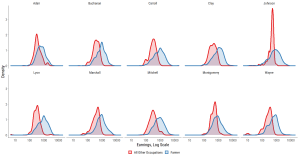
This variability is clear in one of my favorite datasets, the Goldin and Katz sample of the 1915 Iowa state census. Iowa, 25 years before the federal government, asked about earnings. And, unlike in the Federal 1940 Census, farmers in Iowa answered the earnings question.

Even when compared to all other occupations, farmers report a wider range of earnings. Among occupations with more than 50 respondents in the Iowa sample, farmers have the highest standard deviation in log earnings. And this is just within Iowa, a state not exactly known for its crop or geographic or climatic variation over space. Imagine how this distribution might look including southern cotton farmers or vegetable farmers from California.
Having a large (but shrinking) share of the population working in an occupation about which we have a hard time distinguishing between high and low status can really threaten a time series.
Farmers and Occupation Scores
To add another layer of frustration, the socioeconomic status of farmers has (we think) declined over time as their numbers have declined. But we aren’t sure of the exact trends because (1) the US census only records wealth in three years (1850, 1860, and 1870) and earnings in one (1940); and (2) that wealth is gross, not net, and earnings is labor only, so farmers report working 52 weeks in 1939 but earning zero dollars. Awesome.
Our solution to the lack of earnings or wealth data is usually an occupation score. The idea is to give everyone in a given occupation some score that, roughly, indicates their socioeconomic status even at the cost of eliminating all intra-occupation variation. The simplest version is one generated by IPUMS using median earnings in each occupation code (farmer is a code, so is librarian or chemist or blacksmith) in 1950.
There are variations on occscore. We might be worried 1950 is too far in time from whatever we’re studying. Olivetti and Paserman (2015) used the 1901 Cost of Living Survey; others use the 1940 census; Collins and Zimran (2019) generate occupational wealth scores from the nineteenth-century censuses with wealth. We might want to adjust for region or race or age, something Saavedra and Twinan (2020) do with a machine learning procedure. We might even want occupation scores to change over time to reflect occupations rising or falling in status (like farmers). Song et al (2020) have scores based on human capital (literacy and education) that do just that.
But while intra-occupation variation in earnings or wealth or status is an issue for lots of occupations, for farmers it is huge. We can’t just give all farmers get the same status score and hope for the best, right?
Why Do I Care?
This problem is in front of my mind. In work with Dan Thompson, Andy Hall, and Jesse Yoder, we are studying where American politicians come from by linking members of congress (MCs) to the census (I told you the HPE angle was coming). Our initial foray linked MCs just to 1940 but that has since mushroomed into census links of every MC born between 1830 and 1940 (and dead as of today). We know that MCs are highly selected (they have higher status occupations and earn more as pre-Congress adults and have more education) and we can show that they come from highly selected families (basically, their fathers are quite high status as well). This contrasts with work from Sweden by Ernesto Dal Bo, Fred Finan, Olle Folk, Torsten Persson, and Johanna Rickne that shows selection of Swedish politicians but in a relatively more open system where parental status is more representative.
And how has this selection of US MCs changed over time? I think we’re finding some very interesting trends in MCs’ childhood socioeconomic statuses. Very, very interesting. But I write think (and will be intentionally vague about the trends) because I’m not 100% sure yet. The problem (which several wise seminar audience members felt quite strongly about) comes back to farmers. Many MCs, though fewer than a random person drawn from the population, are descendants of farmers. Are their farmer fathers wealthy landowners with a plantation (and before emancipation slaves)? Or are their fathers homesteaders or sharecroppers or something else? The problem is that we aren’t sure. The census just reports that they are a farmer, like John Lewis and John Hollis Bankhead whose fathers occupied quite different places in the economic distribution.
One common solution, and one I’m not especially opposed to, is to just drop farmers and see what difference (if any) that makes. I do that in my Iowa intergenerational mobility paper; Abramitzky, Boustan, Jacome, and Perez (2021) do it when studying intergenerational mobility of immigrants, and I’m sure many of you have been tempted to just `drop if occ1950 == 100`. But while that might do for a robustness test, I think we all need to do better.
Possible Solutions
A pair of solutions address one source of variability within farmers directly. The first comes from Collins and Wanamaker (2017) and seems well suited for the middle of the twentieth century. We do see farm laborer earnings in 1940. (Roughly, you are a farm laborer if you work on a farm but aren’t in charge.) We also see both farmer earnings and farm laborer earnings in 1960. Assuming the ratio between farmers and their hired help is constant, we can scale farm labor earnings to predict farmer earnings. We can do this by race and region (and immigration status as in Abramitzky et al (2021)). But while this will work for 1940 when I have farm laborer earnings, I would really like to know about the status of MCs and their farmer fathers going back to 1850. Also, the assumption about the ratio between farmers and farm labor earnings might get less and less likely to hold as we move back in time as well.
Another idea, coming originally from Abramitzky, Boustan, and Eriksson (2012) uses the 1900 Census of Agriculture with data on county-level revenues and expenditures. This allows us to know something about farmer earnings while accounting for some variation in crops and average farm sizes. This is compelling too. But in addition to anchoring the analysis to 1900 (full disclosure: I need to do my due diligence and check if other Censuses of Agriculture exist with comparable county-level revenue and cost data), it only allows for across county variation in farmer status. The Iowa example above comes from a sample of just 10 rural counties. As the following small multiple makes (somewhat) clear, even within county there is a ton of farmer earnings variation; as much or more than the variation across all other occupations (from lawyer to laborer).
So what is the solution to farmers when we want to know about their status over a long period of time and all we have is complete count census data? Well, if I knew, I’d probably be working on my paper and not this post. But at least I can state the parameters of what a good measure of farmer status might be. Farmer socioeconomic status varies a lot within the occupation, both over time and across place and within place. We need a measure of farmer socioeconomic status that varies within occupation that:
Is reasonable to use from 1850 to 1940
Can be calculated from 1850 to 1940
Has geographic variation
Has within county variation
What do we see in most (all?) censuses that can tell us about a farmers’ status? One idea, and it is only an idea so far, draws on household composition in the census. The US censuses, at least from 1850-1940, are recorded as individuals nested within households. These households, however, are not strictly families. A boarder or a lodger or a butler or a servant who lives in your house would be enumerated in your household.
Household employees or servants could be a plausible measure, at least of top-end status. Few if any sharecroppers will have a servant or maid or housekeeper living in their households, but some of the wealthiest planters might.
At the other end of the distribution, we could measure whether or not households have boarders and lodgers. This is a measure that I know has some real economic content. In work with Philipp Ager, Casper Worm Hansen, and Huiren Tan, we study the effects of immigration in the early 20th century on crowding and mortality and we turn to boarders and lodgers as a useful measure of residential crowding. There we see that when the Quota Acts of 1921 and 1924 reduced dramatically the number of immigrants entering the US, American cities grew much less crowded (in particular, those cities that were more quota-exposed, see the paper for the details) with positive effects on infectious disease mortality.
From 1880 on, these household relationship variables should do the trick, at least to identify farmers at the highest or lowest rungs of the socioeconomic ladder. But for 1850-1870, non-relative household residents are all aggregated to one “roomers/boarders/lodgers” category. This is because the original censuses were enumerated without a guide to intra-household relationships. So a household with a non-relative could be quite rich (a servant or maid or another employee) or relatively poor (taking in a boarder for extra earnings).
We do have wealth data for 1850-1870, so maybe a patchwork solution is possible?
To Conclude…
Other than stoking your hatred of farmers, what have we learned? In a lot of HPE work, we’re usually above the nasty fray of data that doesn’t quite record what you want it to record. Farmers aren’t the only problem like this though they are a big one. But to ask and answer the big questions (in my case: where do MCs come from and how as their selection changed over time), we’ve got to do the dirty data work and figure out how to measure what we want and need.